Public Health
Find programs and resources to support the health and well-being of you and your family.
Access health services provided directly by Berkeley Public Health, including the Women, Infants, and Children (WIC) program, and services for Berkeley High School and Berkeley Tech students. Find services to help you prevent illness, such as low-cost health and dental check-ups, lead poisoning prevention, immunizations, and more. Health care providers can find ways to collaborate and communicate with Berkeley Public Health.

Family Wellness Services
Programs and services to help your family's wellbeing

WIC
The Women, Infants, and Children (WIC) Program provides support with nutrition and breastfeeding

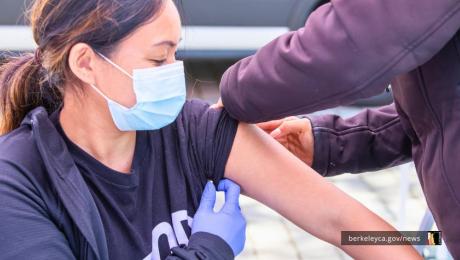
Vaccination Services
Get vaccinated for free through the Immunization program at the West Berkeley Family Wellness Center